How To Read a Turbo Pressure Map
 11-14-2005, 09:45 PM
#1
Senior Member
Thread Starter
Join Date: 11-14-05
Location: www.mp5t.com
Posts: 4,425
Likes: 0
Received 0 Likes
on
0 Posts
For as many different types of people out there, there are as many different types of Turbos. Each has different Properties that are desirable and some have major drawbacks. They must be selected based on their qualities. A Turbo is tested for it's capabilities and qualities and that data is put on a graph called a Compressor Map. When looking at a Turbo upgrade, it is very useful to check it out for yourself rather than just asking "What do I need"
This FYI is not my work, It is a Repost!
How to read compressor maps
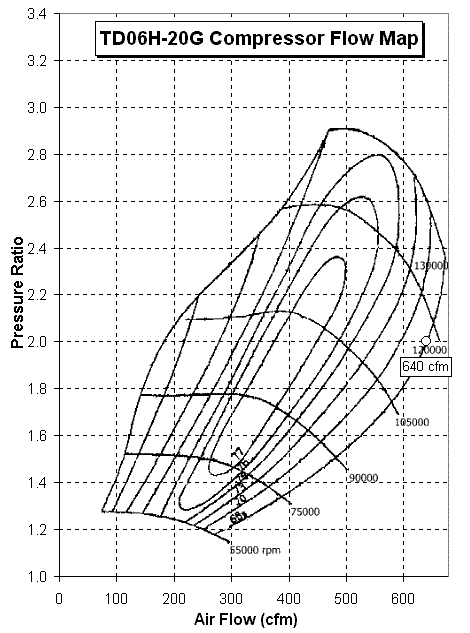
On a 2-Dimensional pressure map...
The curved line means the rpm of the compressor wheel.
The Elliptical circle means the compressor's efficiency area.
It's marked by the percent sign.
The horizontal axis is the amount of air before turbo,
(1 m3/s = 2118.88 cfm, 10 lb/min = 144.718 cfm).
The vertical axis is the pressure ratio.
Pressure Ratio=The pressure at compressor exducer vs the pressure at compressor inducer.
In another word, the ratio of the pressure of the air after compression vs the pressure before compression. As you can see, the pressure ratio depends on the ambient pressure. For example, at sea level, a turbo boosts 14.7psi. Ambien pressure is 14.7psi. That's 2 pressure ratio (PR) on the compressor map. Take that turbo to a higher elevation, the ambient pressure is less than 14.7psi. If the turbo still boosts 14.7psi, the pressure ratio would be higher. Now on the compressor map, you will see by moving up along a vertical line (to pump out the same cfm) and turbo efficiency has decreased as the elevation increases (PR increases). Simply put, turbos lose performance and become less efficient as elevation gets higher.
The area to the right of the outer most elliptical circle is the least efficient area,
choke area.
It means when the compressor reaches certain rpm, the air moved by the compressor wheel in the diffuser area of the compressor housing is moving at or past the speed of sound. When the air speed reach sounic speed, the amount of air flow increase is very small as compressor wheel rpm increases. In plain words, the compressor has reached its limit. You can try to pump more psi, have to wheel spin faster, but very little more air is pumped out the turbo compressor. You can see now, the compressor housing will need to properly match the compressor wheel. If you simply stuff a big wheel inside a small compressor housing, the diffuse area will be very small. This causes the air inside the housing to move at higher speed. That's why some of the so-called T28s which use a bigger compressor wheel inside the stock compressor housing does not produce good hp.
Compressor Max Flow
The max flow of a compressor is shown on the compressor map. On the map, look for the interception of maximum compressor wheel speed (rpm) and the least compressor efficiency curve. Find that interception. The horizontal coordinate is the max flow.
The area to the left of Max Flow is 'choke area'.
The vertical coordinate is the pressure ratio at which the compressor reaches that max flow. From this boost level, as the boost increases, very little air flow is increased. For example, if a compressor reach max flow at 2 PR or 1 atm pressure or 14.7psi, higher boost does not pump more air into the motor. But higher boost may be needed to increase the manifold pressure for the motor to flow more air. A 5 liter motor with this turbo needs 15psi of manifold pressure to flow a certain CFM. A 3 liter motor with the same turbo will need much higher manifold pressure to flow the same amount of air although that turbo's compressor does not flow more air past 14.7psi.
Compressor Max Pressure
On the map, find the top-most point on the graph. The vertical coordinate is the max pressure ratio. For example, 2.8 pressure ratio at sea level is 1.8 times the atmospheric pressure, 1.8x14.7psi=26.46 psi.
Compressor max pressure is limited by compressor wheel speed. It's physically impossible to boost higher than this max pressure for one particular turbo. Plus the pressure drop in the intercooler system, the actual max boost reading from a boost gauge that's plugged into the intake manifolds maybe a few psi lower than this max pressure.
Finally, what a compressor map reads:
Most manufactures rate their turbos at 15psi. That's 2 pressure ratio. On the map, draws horizontal line from 2PR. When the line intercepts the right-most elliptical circle, the corresponding number on the x-axis is the max cfm the turbo can flow at 15psi.
Use the TD05-16G's map for example, where the 2 PR line hits the right-most efficiency curve, it reads 520cfm as its flow rate at 15psi.
Compare Compressor Maps
Well, compressor maps are really 3-Dimensional maps. Any compressor map looks a hill/peak in 3 dimensions. Our compressor maps look like if you look at the hill directly from above vertically.The eclliptical lines of elevations are the efficiency curves. Since in theory, we can always boost more and decrease turbo efficiency to get more cfm, lets set the same Pressure Ratio and compare turbos at the same efficiency curves.
This FYI is not my work, It is a Repost!
How to read compressor maps
On a 2-Dimensional pressure map...
The curved line means the rpm of the compressor wheel.
The Elliptical circle means the compressor's efficiency area.
It's marked by the percent sign.
The horizontal axis is the amount of air before turbo,
(1 m3/s = 2118.88 cfm, 10 lb/min = 144.718 cfm).
The vertical axis is the pressure ratio.
Pressure Ratio=The pressure at compressor exducer vs the pressure at compressor inducer.
In another word, the ratio of the pressure of the air after compression vs the pressure before compression. As you can see, the pressure ratio depends on the ambient pressure. For example, at sea level, a turbo boosts 14.7psi. Ambien pressure is 14.7psi. That's 2 pressure ratio (PR) on the compressor map. Take that turbo to a higher elevation, the ambient pressure is less than 14.7psi. If the turbo still boosts 14.7psi, the pressure ratio would be higher. Now on the compressor map, you will see by moving up along a vertical line (to pump out the same cfm) and turbo efficiency has decreased as the elevation increases (PR increases). Simply put, turbos lose performance and become less efficient as elevation gets higher.
The area to the right of the outer most elliptical circle is the least efficient area,
choke area.
It means when the compressor reaches certain rpm, the air moved by the compressor wheel in the diffuser area of the compressor housing is moving at or past the speed of sound. When the air speed reach sounic speed, the amount of air flow increase is very small as compressor wheel rpm increases. In plain words, the compressor has reached its limit. You can try to pump more psi, have to wheel spin faster, but very little more air is pumped out the turbo compressor. You can see now, the compressor housing will need to properly match the compressor wheel. If you simply stuff a big wheel inside a small compressor housing, the diffuse area will be very small. This causes the air inside the housing to move at higher speed. That's why some of the so-called T28s which use a bigger compressor wheel inside the stock compressor housing does not produce good hp.
Compressor Max Flow
The max flow of a compressor is shown on the compressor map. On the map, look for the interception of maximum compressor wheel speed (rpm) and the least compressor efficiency curve. Find that interception. The horizontal coordinate is the max flow.
The area to the left of Max Flow is 'choke area'.
The vertical coordinate is the pressure ratio at which the compressor reaches that max flow. From this boost level, as the boost increases, very little air flow is increased. For example, if a compressor reach max flow at 2 PR or 1 atm pressure or 14.7psi, higher boost does not pump more air into the motor. But higher boost may be needed to increase the manifold pressure for the motor to flow more air. A 5 liter motor with this turbo needs 15psi of manifold pressure to flow a certain CFM. A 3 liter motor with the same turbo will need much higher manifold pressure to flow the same amount of air although that turbo's compressor does not flow more air past 14.7psi.
Compressor Max Pressure
On the map, find the top-most point on the graph. The vertical coordinate is the max pressure ratio. For example, 2.8 pressure ratio at sea level is 1.8 times the atmospheric pressure, 1.8x14.7psi=26.46 psi.
Compressor max pressure is limited by compressor wheel speed. It's physically impossible to boost higher than this max pressure for one particular turbo. Plus the pressure drop in the intercooler system, the actual max boost reading from a boost gauge that's plugged into the intake manifolds maybe a few psi lower than this max pressure.
Finally, what a compressor map reads:
Most manufactures rate their turbos at 15psi. That's 2 pressure ratio. On the map, draws horizontal line from 2PR. When the line intercepts the right-most elliptical circle, the corresponding number on the x-axis is the max cfm the turbo can flow at 15psi.
Use the TD05-16G's map for example, where the 2 PR line hits the right-most efficiency curve, it reads 520cfm as its flow rate at 15psi.
Compare Compressor Maps
Well, compressor maps are really 3-Dimensional maps. Any compressor map looks a hill/peak in 3 dimensions. Our compressor maps look like if you look at the hill directly from above vertically.The eclliptical lines of elevations are the efficiency curves. Since in theory, we can always boost more and decrease turbo efficiency to get more cfm, lets set the same Pressure Ratio and compare turbos at the same efficiency curves.
 11-14-2005, 09:46 PM
#2
Senior Member
Thread Starter
Join Date: 11-14-05
Location: www.mp5t.com
Posts: 4,425
Likes: 0
Received 0 Likes
on
0 Posts
As a rule of thumb, A Large turbo will be better at making allot of pressure but will spool later than a small turbo. A Small turbo will build boost early but is less capable to make big boost pressure.
Here is a pressure map for my 2.0L Mazda
The blue dots represent the air used by the 2.0L at 7500RPM, the redline is normally 6500 RPM so the dots are "Worst Case Markers" Normally the dots fit in the middle of the graph.
The Red Is a GT-25 Garrett
The Black Is a GT-28RS Garrett
The GT-25 being a small turbo is very quick to spool, around 2500 RPM so it makes for a very drivable car. As you can see, if you push it too much in Pressure the dots simply fall out of the graph. 15 PSI and the turbo is struggling to meet the demand.
The GT-28 is a larger turbo; It requires more exhaust to "Spool" the turbo so it hits more in the range of 3100 RPM. It is very comfortable at 15 PSI but the drawback is that it makes pressure later. If the boost was 10 PSI on two cars equipped with both turbos, the Smaller GT-25 Equipped car would perform better. If you had an engine that could handle the higher boost, the GT-25 would simply not be able to make it and the GT-28RS would walk away. This is meant to be an introduction rather than a complete subject. There are more details that have not been covered but this is a good base to start discussion.


Thread
Thread Starter
Forum
Replies
Last Post